|
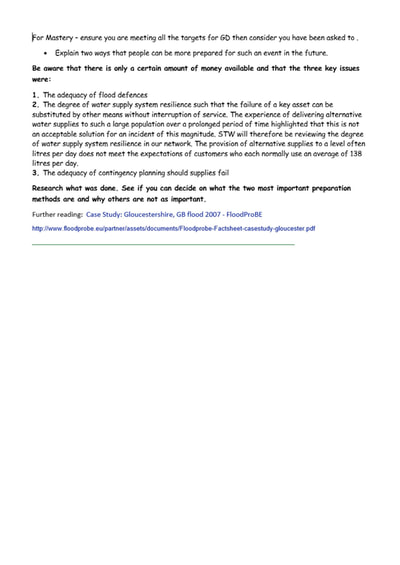
As promised here are some information and links to help you with this homework. Key documents are below. Websites worth visiting are:
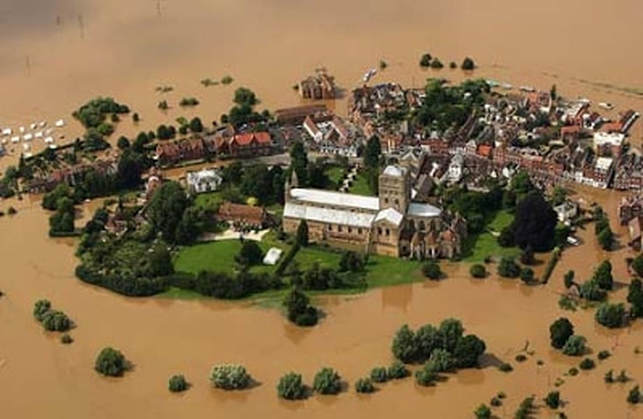
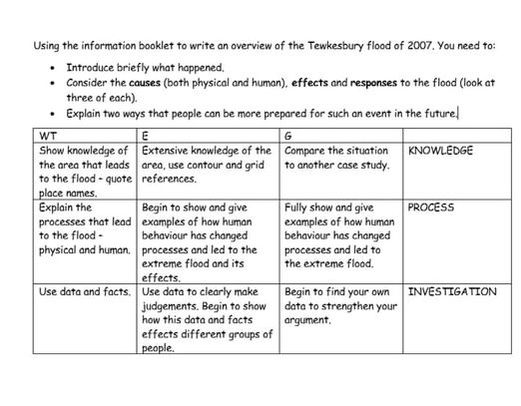
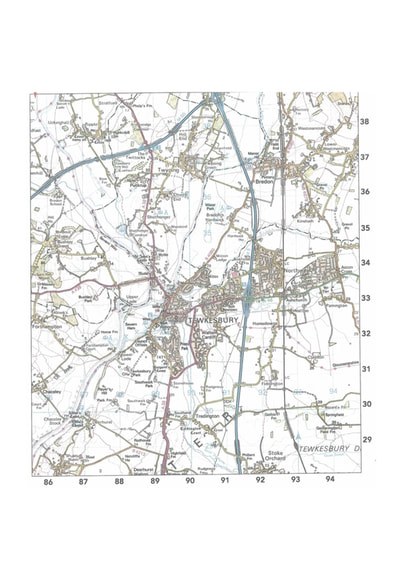
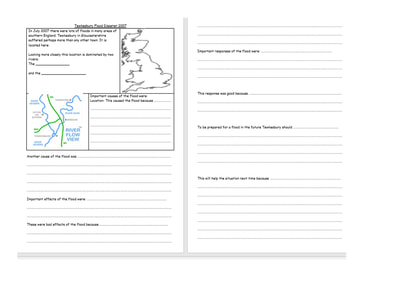
https://sites.google.com/site/ukfloods/flooding-case-studies/tewkesbury-floods--july-20th-2007 https://www.bbc.com/education/guides/zx9kfrd/revision/5 https://www.youtube.com/watch?v=kTVmhALvexU&t=64s http://www.floodprobe.eu/partner/assets/documents/Floodprobe-Factsheet-casestudy-gloucester.pdf In quoting a grid reference it is hard to see the contour lines. You may comment on how many contour lines there are across 8km (the width of the area shown on the map) and how few high points there are in the area. Any concerns please come and see me. A key part are your suggestions on is how people can be more prepared for such an event in the future. Consider the sustainability for everyone in the environment. Use this website: http://www.bbc.co.uk/schools/gcsebitesize/geography/water_rivers/river_flooding_management_rev5.shtml Remember to use the criteria in the grid below to present the right material. You can add your own data, charts and photographs. I am happy for this work to be done on a computer. Two pages of A4 is all that is required. Mr Greetham |
Year 8 NewsWhat's been happening in Year 8? Categories |


 RSS Feed


9/5/2018
1 Comment